


College Basketball Betting: THE WINDOW’s run to March Madness
Using your basketball beliefs for a high-volume, micro-betting approach

Football season is finally over, and you’re either thinking:
“Phew! That was a lot. I could use some time off the sweats.”
Or
“Alright, what’s next at THE WINDOW!?!”
What if I told you that, for the next month, we could go on a wild, weird ride of sports betting that you didn’t think possible?

There are 364 teams in Division-I College Basketball, and I don’t know a thing about almost all of them. But somebody out there does. Luckily, there are smarter people, doing more focused work on the sport, while we were consumed with football season.
They’ve culled all the stats and they’ve created team ratings using formulas that you and I will never fully understand. They are, quite clearly, doing better work than we would be by simply tuning in to the big games during the week and immersing ourselves each Saturday, only to go by what is little more than instinct.
That “gut feeling” isn’t worth anything. The sooner you admit that, the better off you’ll be as a bettor in any sport. However, we know SOMETHING about hoops. We know what a good shot looks like.
At least enough to shake our head when we see some kid throw up a bad one early in the shot clock, before it even rattles off the rim. We murmur “Nope” as soon as the trigger gets pulled.
Instead of taking our understanding of basketball, and cluttering it with what we saw most recently in a game that we just happened to be watching, why not but together a thesis of our own? Then we can use the work that the smart people, who’ve been watching ALL the games, and apply that to how we see the game of basketball (without ever learning the names of anyone on Murray State, Abilene-Christian, or Cal Poly).
While we were betting on football, data points piled up in college basketball. At this point in the season, the numbers should tell the story.
But WHICH numbers are doing the story-telling?
Here’s the most important takeaway you should ever have from THE WINDOW:
Bet what you believe in, not who you believe in.
If you believe the team who shoots the three better is going to win and/or cover more than 53% of the time, just look up their 3-point shooting numbers before you pick a side and bet that. If you have some other (combination of) statistics that you swear by, use those.
Here’s what I believe:
In general, Basketball games are won by the offense that gets the best (most efficient) shots combined with a defense that forces the opponent into bad shots. All other statistics are just street signs on the road to getting to those two things. (If, in any single game, your team misses good shots, or the opponent makes the hard ones, you tip your cap)
Kenpom.com’s net efficiency scores are the gold standard of team ratings, and the market often follows their projections in evaluating a point spread
Shotquality.com does a great job of explaining how their models work and how they calculate the quality of each shot taken in a game
While point spreads are built off of market ratings based on results of the PAST, knowing a team’s ShotQuality metrics gives us a clue to what might happen in the FUTURE. If you keep generating good shots and are preventing the opponent from getting good shots (or the “vice-versa” negative), eventually the sample size will be big enough that your results will reflect that. In short, water will find its level.
The Math Portion:
Alas, it’s more complicated than that, as there always has to be a math component when a betting market is putting a numeric value on teams. Otherwise, how would you get a point spread projection to compare to the number offered to bet?
I take ShotQuality’s metrics and turn them into a rating, and then average that rating with KenPom’s (both are based off an integer where 0 is an average basketball team). From there, the “proprietary secret” is the formula that creates a rating number relative to a possible point spread and the application of home-court advantage (HCA).
Eg. If Duke is a 43.6 (out of 50) and Houston is a 47.2, the Cougars are projected as -3.6. If they played in Houston, that number goes up for the Cougars’ HCA. If played at Cameron Indoor that number goes down for the Blue Devils’ HCA. If played on a neutral court - like in the NCAA Tournament, -3.5 is the projected point spread.
Hint: The biggest possible point spread is -50. As in, if the best CBB team ever, played the worst, the game line would be -50. All other matchups fall in-between, down to two evenly matched/average teams meeting on a neutral court projecting as a pick’em. Betting Parameters
If my projected point spread differs significantly enough from the available line then I will bet that side.
Eg. If my line is -5.5 and the point spread is -7, I bet the underdog. If my line is -8 and the point spread (at -110) is -6.5, I bet the favorite, etc.
The higher the point spread, the bigger the separation I need to bet. Here are the margins (right column) that I need to trigger a bet, based on what the game line is (left column).
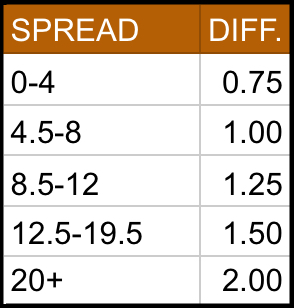
Eg. If the game is a pick’em, I only need to project one side at -0.8 to bet it. If the game is -7, I’ll need more than a point difference because the result may come down to a free-throw. If a game has a line of -15, the last points scored will most likely be a 2-pointer, so I’ll want that as a cushion. A game line of -20 suggests we’ll be seeing the walk-ons late, so I’ll want more than a 2-point cushion on my projection.
Traditionally, it’s advisable to wager 1-2% of our total bankroll. Here, with so much volume, well use a strategy called “micro-betting,” where it’s recommended to bet less than 1% of your bankroll or roughly a quarter of what your standard bet would be on, say, NCAA football.
Bankroll calculation guide:

$100 bettors (with ~ $6000 bankroll) should bet $20 per game
$50 bettors (with ~ $3000 bankroll) should bet $10 per game
$20 bettors (with ~$1000 bankroll) should bet $5 per game
$10 bettors (with ~$500 bankroll) should bet $3 per game
$5 bettors (with ~$250 bankroll) should bet $2 per game

No parlays. All bets are individual tickets.
How often should the bets win?
Ideally, at least 54% of the time - hopefully, slowly accumulating profit over a significant sample size, by betting a LOT of games.
To get ready for this run of games, I’ve been tracking the results since February 1st. In just nine days, over 300 games have qualified as a bet.

Record: 178-140-4 (55.9%)

The “best” day: 12-2
The “worst” day: 8-16

Note: Since the point spread can move from open to close, a game can either:
A) Become a qualifying bet after you first look at the lines
B) You might miss a qualifying bet by looking at a game line after it’s moved
In general, we prefer to bet the games early, to beat any line move. If a move is going our way, we’ve lost value by waiting, and if it’s going against us, there may be some hidden force (injury issue, etc) that we don’t know about.
“Am I crazy, or is that a lot of games?”
That’s a lot of games.
But look at it this way; On an NFL Sunday with 14 games, how many games would you have a bet on the side, total, or teaser leg? Probably at least 10, right?
That’s a bet on 71.4% of the games on a standard NFL Sunday.
What about Thursday Night or Monday Night Football? Was there a primetime game that you didn’t have a bet on this season? If you can bet 100% of the games in a highly-efficient, super-liquid market, you can bet two-thirds of the games in a market with massive variance on a game-to-game basis.
Last Sunday, 92 of the 140 D-1 college basketball games qualified as a bet, or 65% of the games available. If you’re investing a quarter of your college football betting size per game, it’s no different than if you were to bet 23 games on a big CFB Saturday. It’s a lot, but it’s not unheard of.
As always, it’s important to have a plan for how we bet. In a sport with so many teams - whose season amounts to what they do in February and March, our best chance to be profitable is to back the sides that are coached well enough that they’re creating high-efficiency shots on offense and limiting their opponents good scoring opportunities. In turn, we fade teams who’ve had success without consistently creating good shots or playing good defense.
Starting with KenPom metrics (the core basis for how much of the market shapes the lines) allows us to not overreact to a team’s most recent game. After all, why would we expect consistency from college athletes from one game to the next?
On THE WINDOW podcast, we’ve already discussed examples of some of the wild swings in results in CBB games, but Florida’s win over Tennessee by 30 points in Gainesville, was followed by the Volunteers winning by 20 points in Knoxville just a few weeks later (with Tennessee missing two starters!) is a great example of the day-to-day nature of college hoops).
Using ShotQuality metrics creates an edge to one side of the available point spread or the other for most of the games’ matchups each day because we’re applying a predictive element to every team’s core efficiency rating.
Of course, nothing is guaranteed, so, just because teams like Baylor, Gonzaga, and Louisville are ranked higher in adjusted ShotQuality metrics than in market ratings, it doesn’t mean that will translate to a point spread cover in their very next game, but over the rest of the season, their results should be better than the market’s perception of them.
From there, it’s up to the ball to bounce our way at least as often as not - something a large sample size is supposed to flush out.
Starting on Tuesday, February 11th, you’ll receive an email newsletter or app notification from THE WINDOW with a list of games, their point spreads, and our projected lines, that show an edge worth betting. Each piece will have a link back here, for your reference.
Re-stack ‘stack ‘stack it up!: As we venture forward at THE WINDOW, please acknowledge that you’ve found value in this content by liking (❤️) and/or restacking (🔄), to help others on Substack find THE WINDOW. “When I get it right, great! I want you to be able to see my work and understand how I got there, when I don’t.”